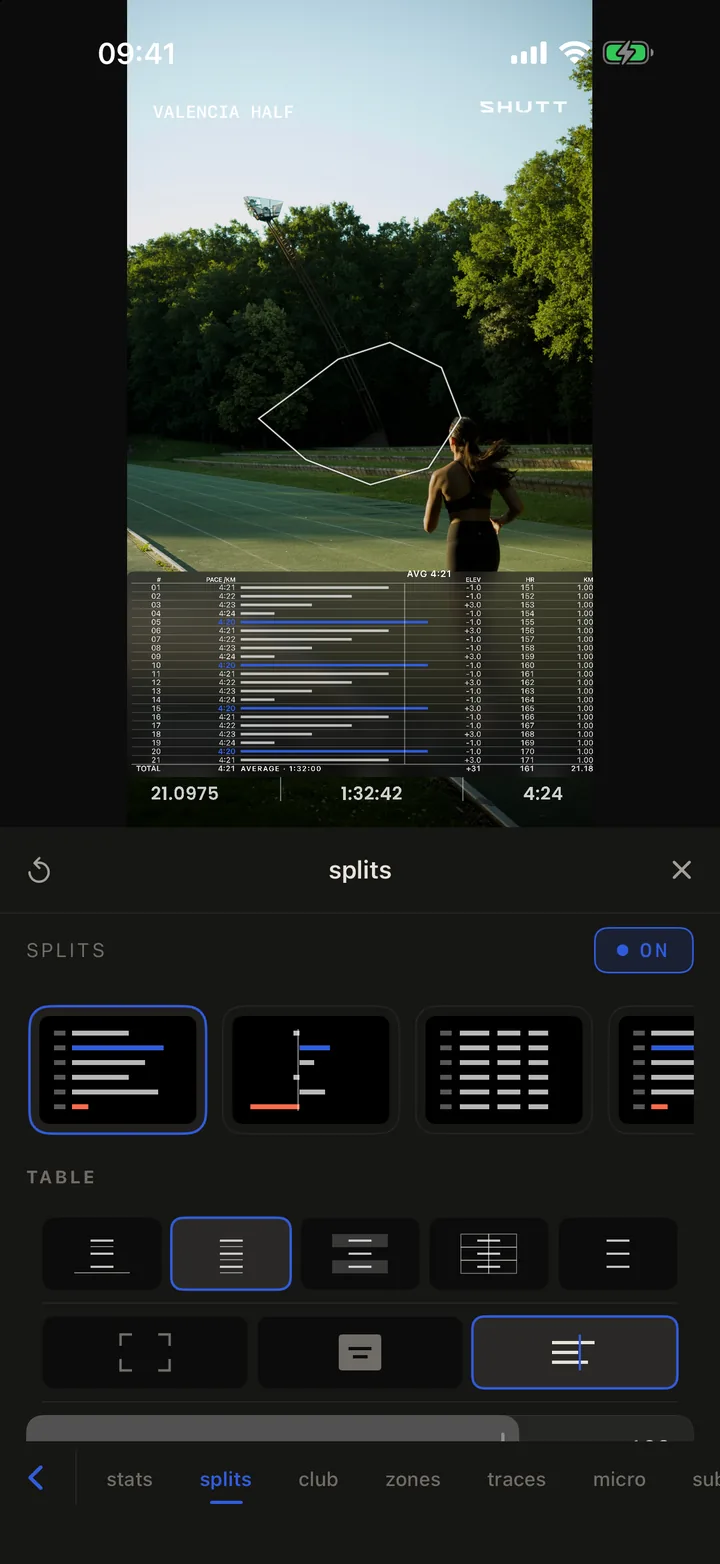
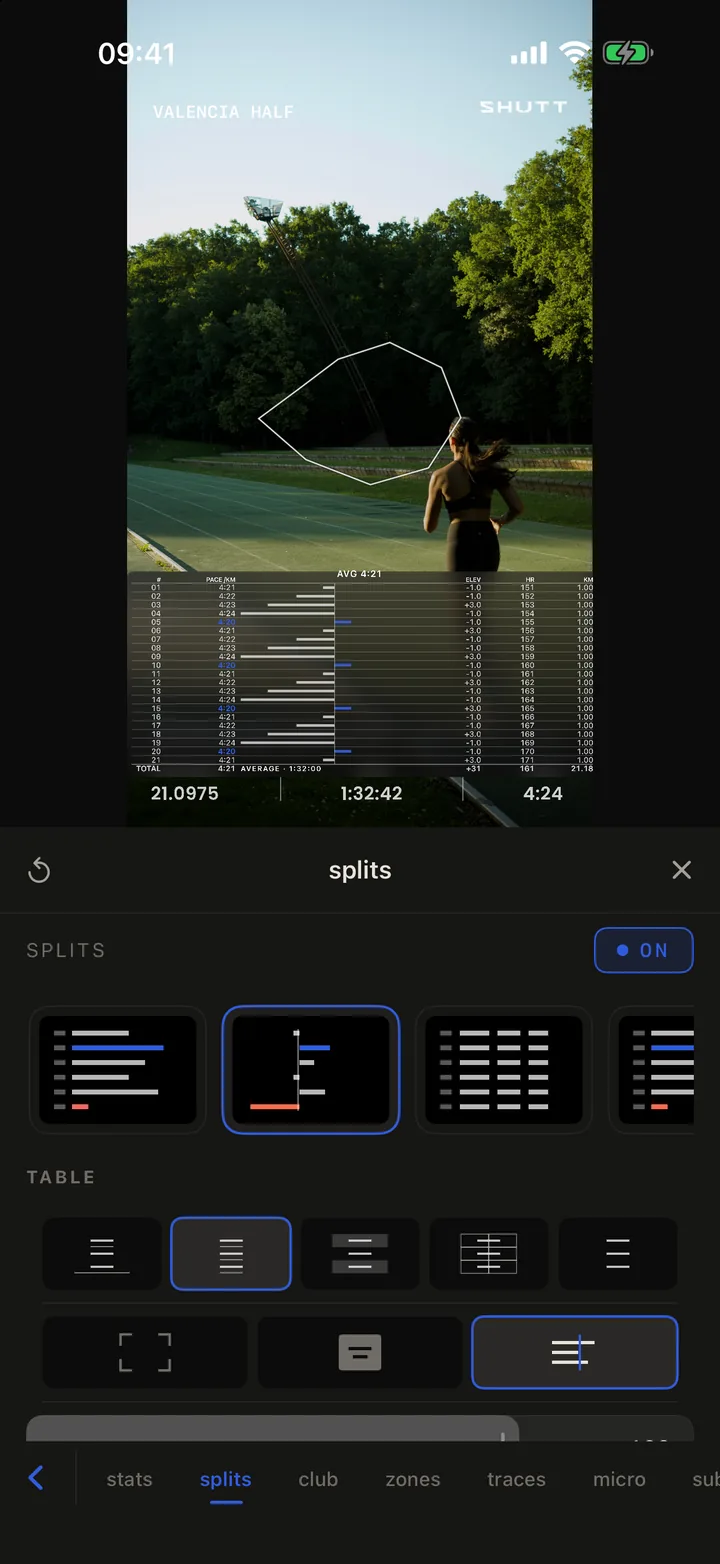
To put splits on a run photo in SHUTT, open the splits panel and pick one of five layouts: a ledger with a bar for every kilometre, a deviation chart around your average pace, a plain table, a pace chart or a heart-rate chart. The splits come from your Strava activity, so nothing is typed. If you would rather start from a finished design, the Meridian and Marker looks are built around splits.
Splits are the stat that tells the story of a workout or a race: whether you held pace, faded or finished fast. They are also the hardest to fit on a phone screen, which is what most of the options below are for.
Can Strava share your splits?
Not as an image. At the time of writing (October 2026), Strava's sharing help page says a shared run carries moving time, distance and pace on a map or one of your activity photos, and that the stats cannot be customised. The splits are in the app, but getting them onto a photo means a screenshot and a crop.
That manual route works, and the guide to splits, heart rate and elevation walks through it step by step. Its limits are Strava's fonts and colours on your picture, and a table that goes soft when you scale it up. SHUTT draws the splits from the data instead, in the type of whatever look you are using.
Which splits layout fits which run?
The splits panel opens with five layout cards. Each card is a small drawing of what it puts on the photo.
| Layout | What it draws | Best for |
|---|---|---|
| Ledger | A table with a bar per kilometre, scaled from your slowest to your fastest | Races and steady runs, where the shape matters |
| Deviation | Bars either side of a line at your average pace | Seeing which kilometres were fast or slow at a glance |
| Table | The numbers only, no bars | Long runs with many splits, where bars would crowd |
| Pace chart | A pace bar chart | Intervals and workouts |
| HR chart | A heart-rate bar per split | Easy runs, to show effort stayed low (Pro to save) |
What can you change in a splits table?
Once a table layout is on, the panel offers:
- Rule style. Rules, Lined, Banded, Boxed or Minimal, chosen by their drawn glyphs.
- Bar scale. Range (from your slowest to your fastest split, the default, so small differences show), From zero (every bar measured from nothing, which flattens them) or vs Average (bars either side of your average).
- Columns. Split number, Pace, Bar, Elev, HR, Time, Cumulative time, Distance, Pace zone and Cadence. Tap a column under TAP TO ADD to show it; it moves up to SHOWING.
- Highlight, under More. None, Fastest, Slowest or both, so the best and worst kilometres stand out.
- Surface, under More. No fill, a solid colour, a gradient or glass behind the table, with blur and shadow sliders.
- Text size, so a 21-row half marathon fits.
On the photo, the table is a block like any other: drag it, and pull its edges to resize it.
Meridian and Marker: looks built around splits
If you would rather pick a finished design than build one, two of SHUTT's free looks put splits at the centre.
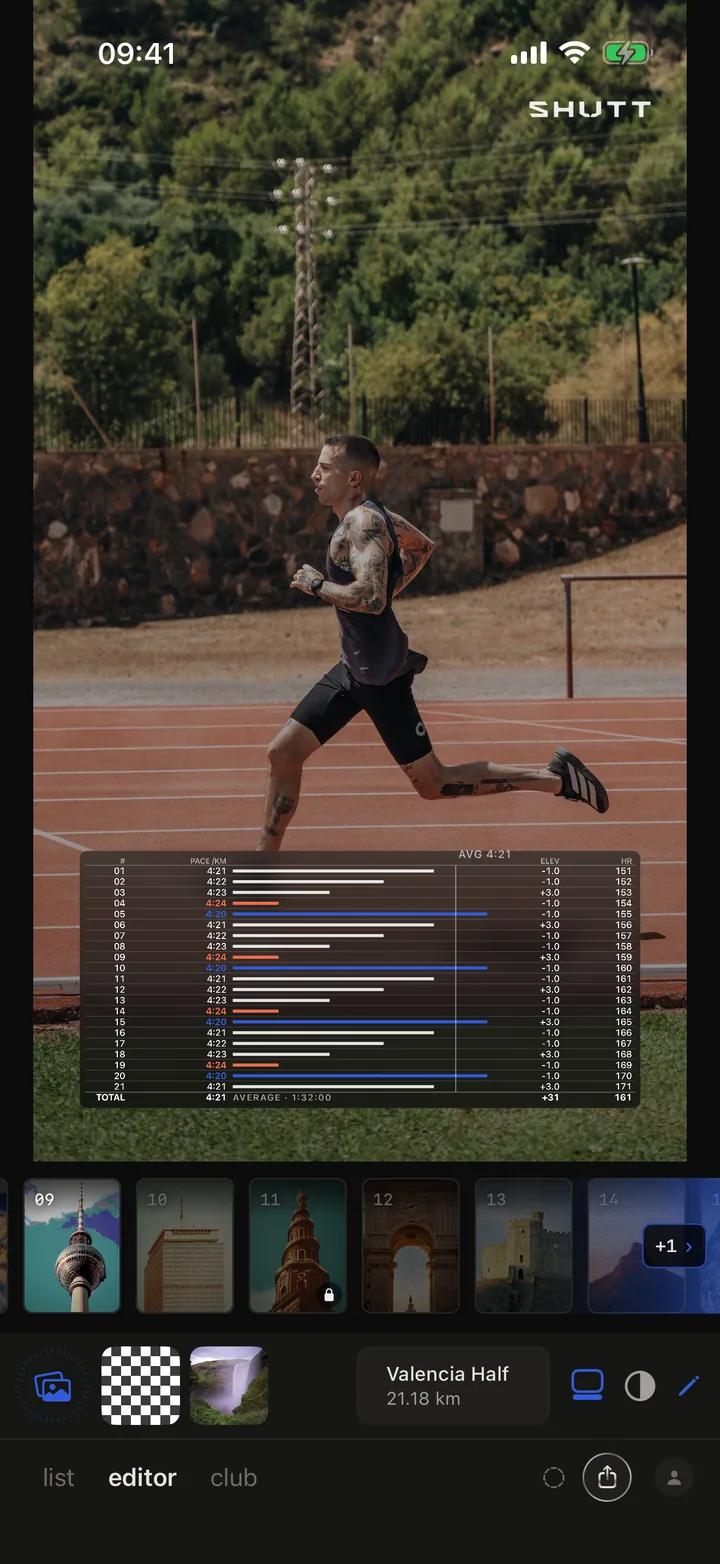
Meridian sets a full splits table over the lower part of the photo: a row per kilometre with a pace bar, the fastest kilometres in blue and the slowest in red, an average line, elevation and heart-rate columns, and a total row. It needs a run with a GPS route.
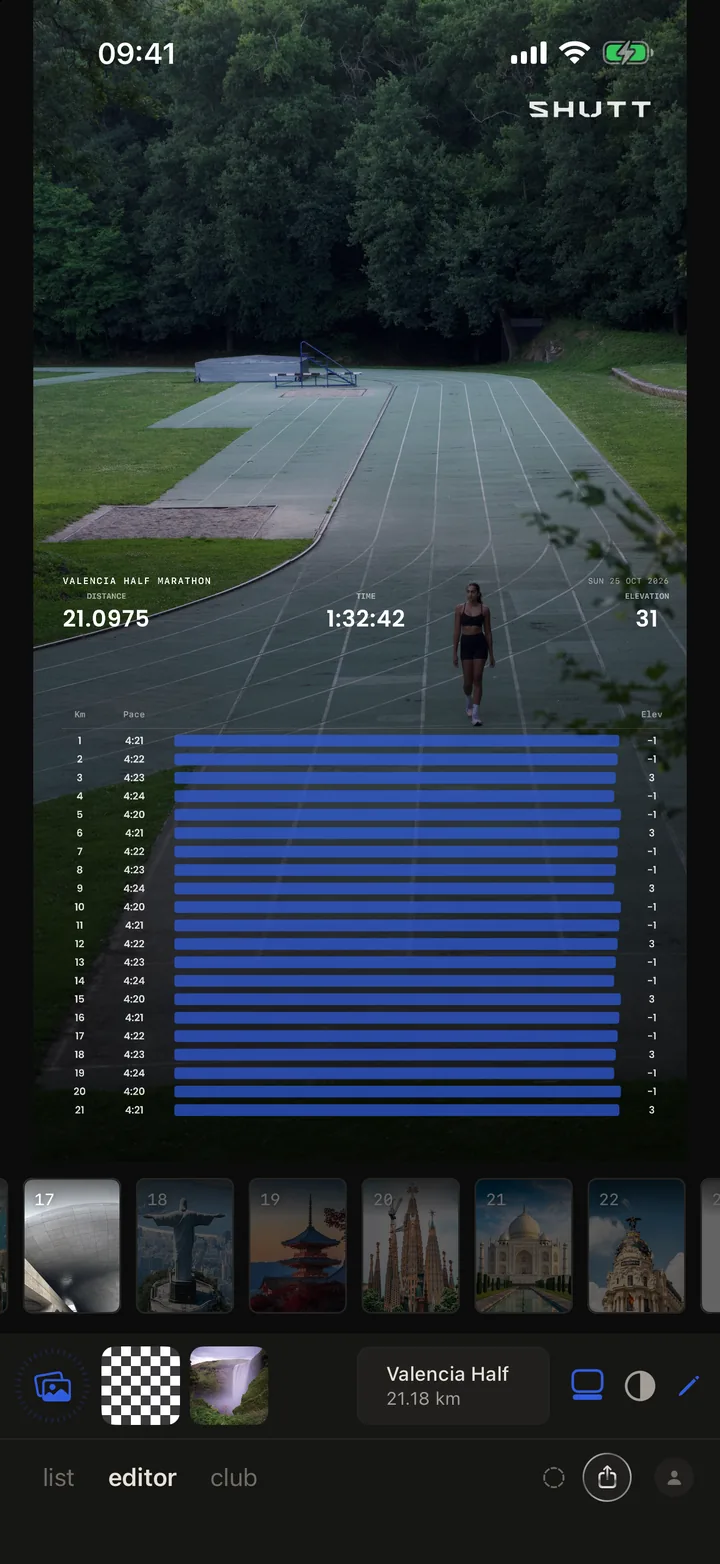
Marker leads with the event: the race or run title, distance, time and elevation across the top, then a long blue bar for every kilometre with its pace and elevation beside it. On a run with even pacing the bars line up into a block, which is its own kind of brag.
What about elevation?
Elevation has two ways in.
The Elevation profile stat. Switch on Elevation profile in the stats panel and the run's profile is drawn as a chart over the photo. Open its row for Width, Chart size, Exaggeration (how much the hills are stretched upwards), Line thickness, Alignment, and Fill, Labels and Smooth toggles.
The Elevation look. One look with seven styles, switched from a row of chips when you tap the pencil: Gain (a big climb number), Rail, Scale (the profile drawn at a fixed metres-per-pixel with the scale printed), Ledger (climb per kilometre either side of a zero line), Ground, Column and Footer. Ledger suits a flat run best, because its bars are scaled to the run's own biggest climb, so even a small rise shows.
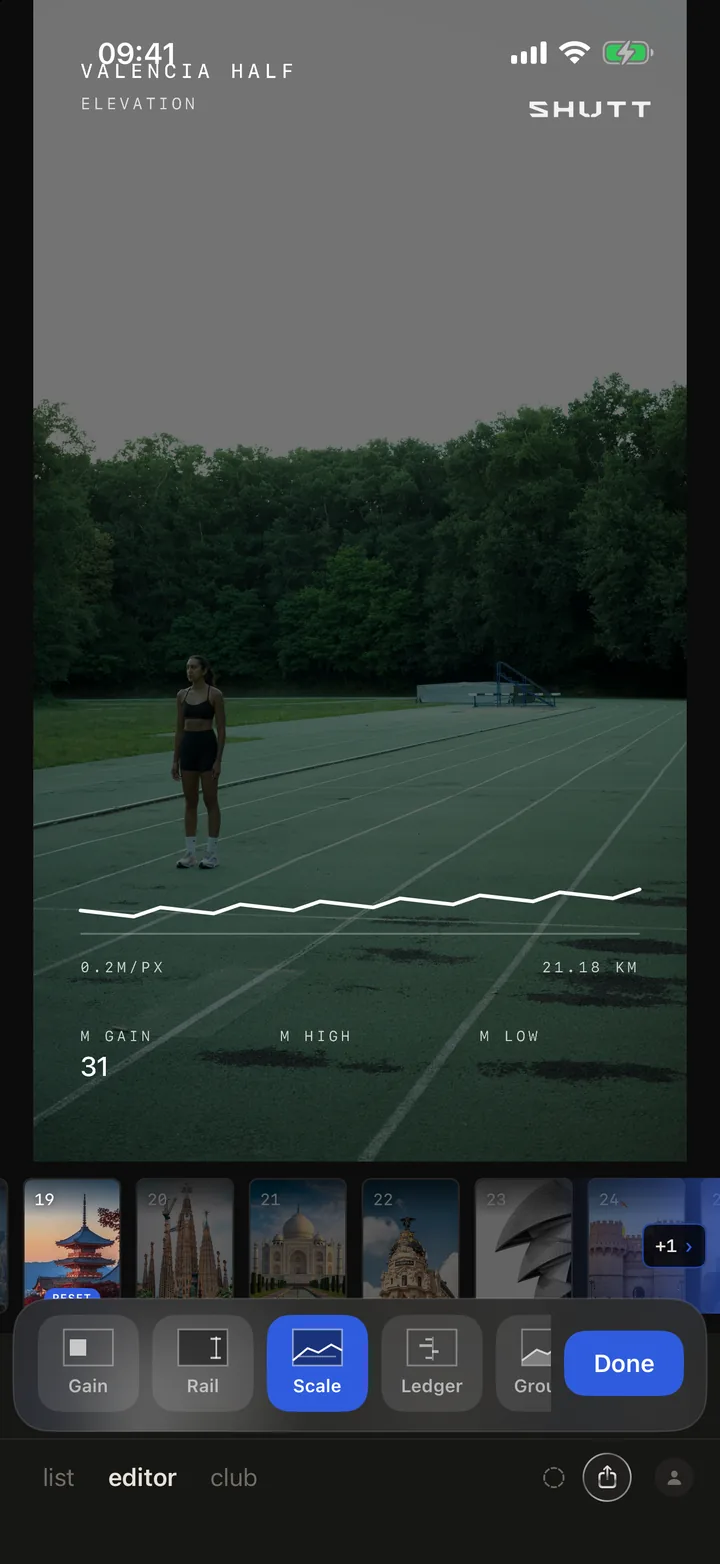
How to do it in SHUTT
- Open a run and a photo in the editor tab. The run needs splits, which Strava records for most runs.
- Tap the pencil, then the splits tab.
- Tap ADD SPLITS. SPLITS switches on.
- Pick a layout card: Ledger, Deviation, Table, Pace chart or HR chart.
- For a table, choose a rule style, the bar scale and the columns.
- Open More for the fastest and slowest highlight and the surface behind the table.
- Drag and resize the block on the photo so it does not cover the runner.
- Or skip the panel and pick Meridian or Marker from the looks rail.
Making splits readable on a phone
A splits table is the densest thing you can put on a photo. A few habits help:
- Show only what explains the run. For intervals, pace and the bar. For a hilly race, add Elev. For an easy day, HR.
- Keep the bars. People read the shape before the numbers, and Range scaling makes small differences visible.
- Highlight both ends. Fastest and slowest is the quickest way to show a negative split or a fade.
- Give it a surface on busy photos. Glass or a dark fill keeps the rows legible over grass and crowds.
- Leave the photo most of the frame. A half marathon table can take the lower third; it should not take the whole picture.
For the stats around the splits, the list of every stat SHUTT can show has the rest, and the guide to SHUTT's looks explains how looks work. The Strava Instagram Story template guide has layouts by kind of post, and the features page sums up everything.