The short answer: for a free Story in ten seconds, Strava's own Sticker Stats is enough. For a designed image where you choose the numbers, show measured power or draw the elevation profile with its climbs, SHUTT (iPhone) is built for that, with five looks made only for rides. StatShot and Picstat are simple overlay apps that also handle rides, Velogram is the long-running paid option for Strava cyclists, and STREIV is the one for your own video with watts on it.
Disclosure: I make SHUTT, one of the apps below, and I have tried to say where the others beat it. Every fact about another app comes from its own App Store listing, website or help pages, or from the press article named next to it, read in November 2026.
Almost every "best app" list for this is written for runners. Rides need different things: speed instead of pace, the climbing, and for many riders, power. So this comparison looks only at what each app does for a ride.
How do the apps compare for rides?
| App | Platforms | Reads Strava | Power on a still photo | Elevation profile | Route | Price (US) |
|---|---|---|---|---|---|---|
| Strava Sticker Stats | iOS, Android | Built in | No | No (gain as a number) | Line | Free |
| Garmin Connect overlays | iOS, Android | Garmin only | Not in the coverage I found | Not in the coverage I found | Outline | Free |
| SHUTT | iPhone (iOS 17+) | Yes | Yes, measured only | Yes, with climbs by category | Line in many styles | Free; Pro $1.99/mo, $17.99/yr, $49.99 lifetime |
| StatShot | iPhone, iPad (iOS 18+) | Yes | No (watts in its video editor) | Not in its listing | Not in its listing | Free; from $0.99/week to $49.99 one-time |
| Picstat | iPhone, Android | Yes, plus GPX | Not in its listing | Yes, as a chart | Yes, styled trace | Free with in-app purchases |
| Velogram | iPhone, iPad (iOS 17.6+) | Yes | Not in its listing | Yes | Yes | $2.99 |
| Solus Data Studio | iPhone, iPad (iOS 15.1+) | Yes | Normalised power (v1.4) | Not in its listing | Not in its listing | Free; Ascent templates $4.99 |
| Run Photo | iPhone, iPad, Android | Yes, plus Garmin | Not in its listing | Not in its listing | Yes | Free; Plus $9.99/mo, $59.99/yr, $99.99 lifetime |
| WorkoutSnap | iPhone (iOS 9+) | Yes, plus Health, Fitbit, Runkeeper | Not in its listing | Not in its listing | Not in its listing | Free; premium $2.99 |
| STREIV | iPhone, iPad, Android | Yes | Video only | Altitude on video | Yes | Free; PRO $9.99 |
"Not in its listing" means the app's own description does not mention it, not that it cannot do it. Try the free version before you rely on it.
Ratings on the US App Store in November 2026: WorkoutSnap 4.8 from 870, Run Photo 4.7 from 192, Velogram 4.4 from 252, StatShot 4.6 from 10, STREIV 4.2 from 51, Solus Data Studio 5.0 from 3. SHUTT and Picstat had too few ratings to show a score.
Is Strava's own sticker enough for a ride?
Often, yes. Strava added Sticker Stats in spring 2025: a transparent sticker you lay over a photo in an Instagram Story. BikeRadar describes it as distance, elevation gain and ride time, with a line drawing of the route and the Strava logo.
The limits, from Strava's sharing help page: shared rides show moving time, distance and elevation, and you cannot change which stats appear. Only rides visible to followers or everyone can be shared. There is no average speed, no power, no heart rate and no profile. The step-by-step version is in how to share a Strava ride on Instagram without a screenshot.
Pick it if: you want it free, now, and three numbers tell the story of the ride.
What about Garmin's overlays?
If you ride with a Garmin, Garmin Connect added transparent activity overlays in April 2026, in 1:1, 4:5 and 9:16, with the route outline, as Gadgets & Wearables reported. The coverage I read does not mention choosing the stats or showing power. It only helps if the ride was recorded on a Garmin.
SHUTT
SHUTT is the iPhone app I make in Valencia. It is compatible with Strava, not made by Strava, and it only reads your activities. On accounts created since late October 2026, rides come in on their own; on an older account, turn on Cycling in Settings.
What it does for a ride:
- Five ride looks, each with two styles, offered only when the activity is a ride: Head Unit (a bike computer's fields, or a lap table), Mirror (power or speed above a line, heart rate below), Étape (a roadbook with the profile and the climbs flagged), Cronaca (the distance huge in a serif, like a sports paper) and Cadre (four numbers framed around a small route mark).
- Power only when it was measured. Average power, normalised power and variability index come from a power meter or smart trainer; Strava's estimated watts are left off. IF and TSS appear once you set your FTP. Best 5-second to 60-minute power needs Pro.
- The climbing. The elevation profile, with the climbs Strava's own formula would categorise flagged from 4 to HC.
- Story (9:16), Post (4:5) or Square (1:1), in km or miles.
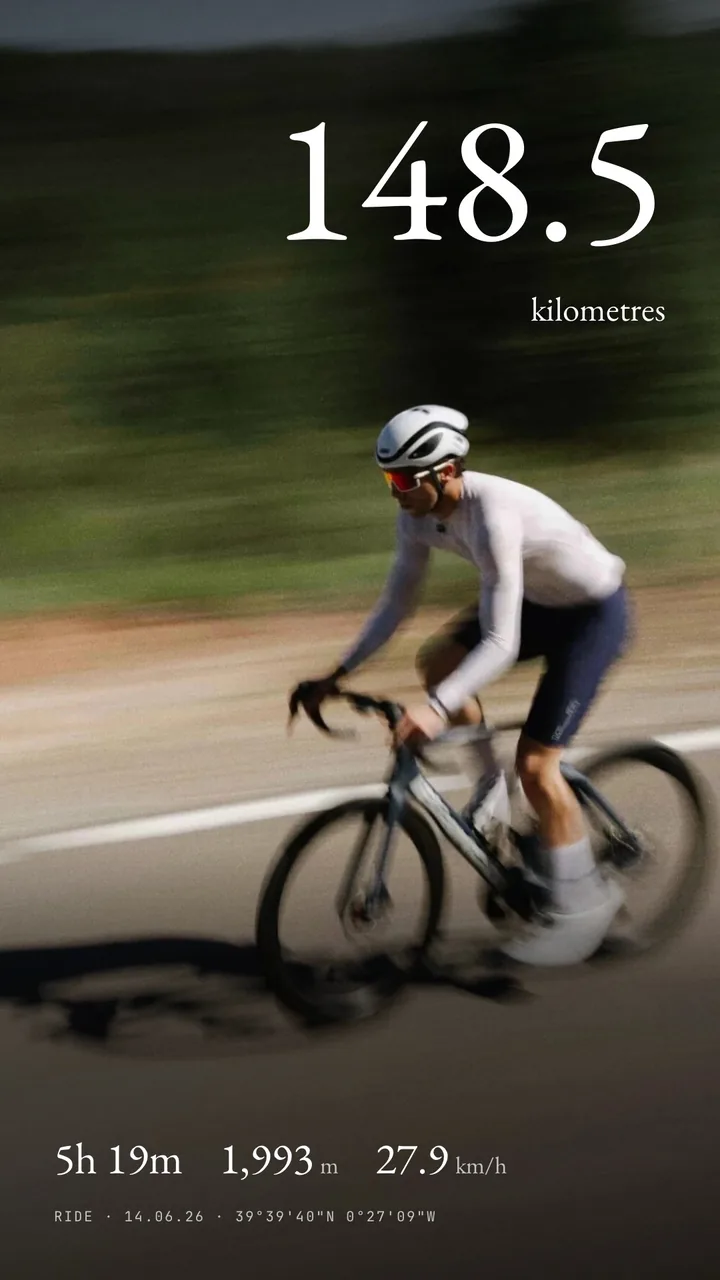
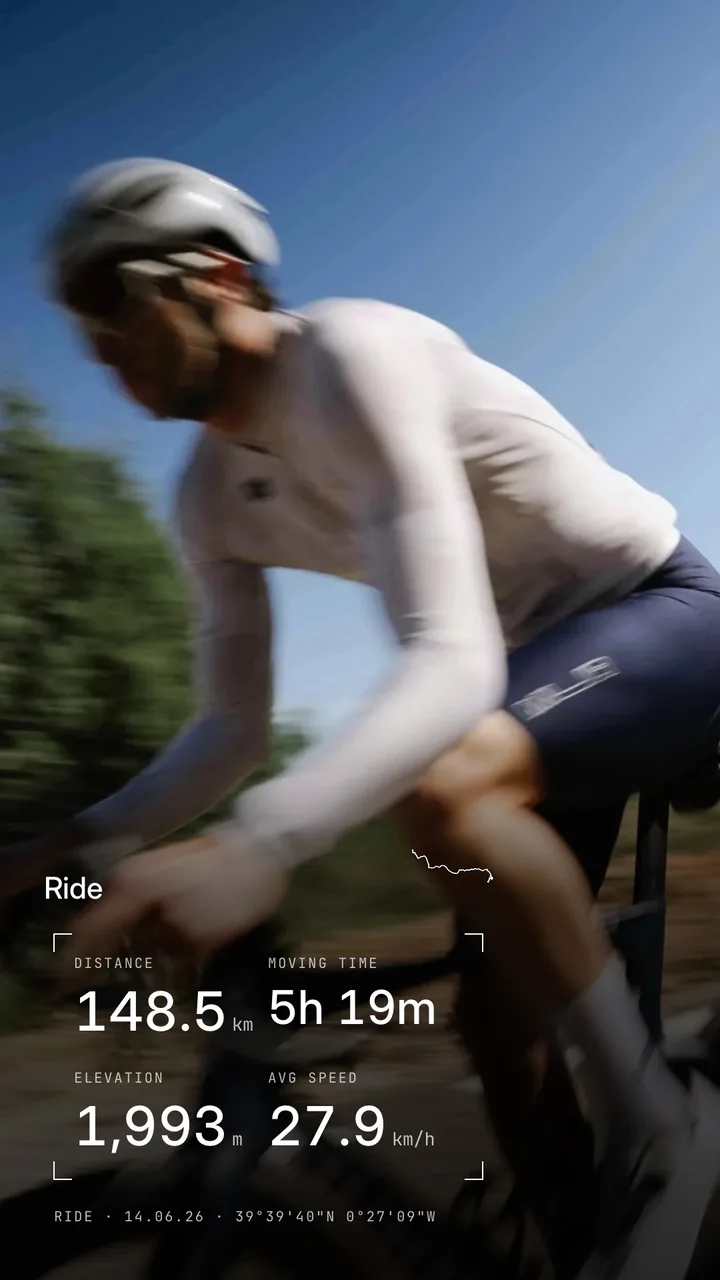
Where others beat it: SHUTT is iPhone only, with no iPad and no Android. It reads Strava only, so a ride that never reaches Strava cannot be used. It has no 3D flyover, and five ride looks is a small set next to template libraries. Free exports carry a small SHUTT mark.
Pick it if: you want the ride to look designed on your own photo, with power or the climbs on it. The full list of numbers is in every stat SHUTT can show.
StatShot
StatShot ("Strava Overlay Tool") imports your Strava activities and puts stats on a photo with your choice of fonts, colours and layout. Its listing names cycling among the supported activities and lists pace and elevation among the stats. Its Telemetry Editor overlays heart rate, power, cadence and speed on an activity video, synced with the footage. iPhone and iPad, iOS 18 or later.
Pick it if: you want a plain, flexible overlay tool, you edit on an iPad, or you want live watts on a video. More in StatShot alternatives.
Picstat
Picstat ("Stats Overlay for Strava") names cyclists in its description and draws your route trace on photos and videos, with charts of pace, heart rate or elevation. It exports 9:16 and 1:1, reads GPX files as well as Strava, and has an Android version. Its listing does not mention power or speed.
Pick it if: you are on Android, or some of your rides live outside Strava as GPX files. Picstat vs StatShot compares the two in more detail.
Velogram
Velogram for Strava Cycling is the long-standing paid option: $2.99, iPhone and iPad, from AppVision. It overlays elevation, the route and stats onto your own images, makes posters and wallpapers from activities, and has stats pages including KOMs and QOMs. Its listing does not mention power. Its latest version on the US store was dated December 2024.
Pick it if: you want a one-off price and a cycling-first app that has been around for years.
Solus Data Studio
Solus Data Studio turns Strava workouts into editorial templates: you choose which data points appear and in what order, and add your own photo. Version 1.4 (September 2026) added normalised power for cyclists and an Ascent template collection, sold for $4.99. iPhone and iPad.
Pick it if: you like a minimal template look and want NP on it.
Run Photo and WorkoutSnap
Run Photo reads Garmin and Strava, works on photos and video, and says it suits runners and cyclists; its listing mentions distance, time, pace and the route, not speed or power. It is subscription-first.
WorkoutSnap stamps workout stats on a photo from Strava, Runkeeper, Fitbit or the Health app, or typed by hand, and lets you change the stamp's colour, size and position. Its latest version on the US store is from May 2020, so check that the Strava connection still works before paying for premium.
STREIV: watts on your own video
STREIV is built for video, not photos. It overlays speed, watts, distance, heart rate, altitude, cadence, slope and temperature from Strava on footage you shot, and you can scale and place each one. If you film your rides on a GoPro, this is the closest match. iPhone, iPad and Android.
Relive is often suggested too, but it makes 3D flyover videos and no longer connects to Strava; more in Relive alternatives.
How should a cyclist choose?
- Free, a Story, three numbers: Strava's sticker, or Garmin's overlays if you ride with a Garmin.
- A designed photo with power, the climbs or the profile, on iPhone: SHUTT.
- The simplest overlay tool, or an iPad: StatShot.
- Android or GPX files: Picstat.
- A one-time price and a cycling-first app: Velogram.
- Your own video with live watts: STREIV, or StatShot's Telemetry Editor.
Whatever you pick, choose the numbers for the ride before the app: elevation on a climbing day, speed on a fast flat loop, power indoors. How to put speed, elevation and the route on a cycling photo has a table for each kind of ride, and SHUTT's ride page shows the looks on real rides.