To share a Strava ride on Instagram without a screenshot, use Strava's own share button, which makes a transparent sticker with distance, elevation gain, ride time and the route for your Story, or use an app that reads the ride from Strava and draws it over your own photo. Both give you exact numbers and a clean image; the difference is how much say you get over which numbers appear and how they look.
The screenshot of the Strava activity page is still what most riders post. It is quick, but it is the app's interface, not your ride: the status bar, the buttons, a map with street labels, and nothing of the road you were on.
What are the ways to share a ride?
| Method | Your photo | Pick the stats | Power or heart rate | Feed post (4:5) |
|---|---|---|---|---|
| Strava Sticker Stats | Yes, under the sticker | No | No | Story first |
| Garmin Connect overlays | Yes | Not that we could find | Not that we could find | Yes (1:1, 4:5, 9:16) |
| DIY in Canva or the Story editor | Yes | Yes, typed by hand | Yes, typed by hand | Yes |
| An app that reads Strava | Yes | Yes | Depends on the app | Depends on the app |
Method 1: Strava's Sticker Stats
Strava added Sticker Stats in spring 2025. BikeRadar's write-up (April 2025, checked November 2026) describes a transparent sticker with distance, elevation gain and ride time, a line drawing of the route and the Strava logo.
- Open the ride in the Strava app.
- Tap the share button.
- Pick the sticker. You can copy it and paste it over a photo, or send it straight to an Instagram Story.
- In Instagram, put a photo underneath, place the sticker, post.
Good: free, inside the app you already use, and the numbers cannot be wrong.
Limits: the ride must be visible to everyone or to followers, so a private ride cannot be shared. The stats are Strava's choice for a ride, so there is no average speed, no power and no heart rate, and the Strava logo comes with it. It is built for Stories.
Method 2: Garmin's transparent overlays
If you ride with a Garmin, Garmin Connect added transparent activity overlays in April 2026, in 1:1, 4:5 and 9:16, with the route outline included, as Gadgets & Wearables reported. The coverage we read does not mention choosing the stats or showing power, which is exactly what riders on Garmin's own forum had asked for. Useful if you are already in Garmin's app; no help if you record on a Wahoo, a Karoo or your phone.
Method 3: Design it yourself
- Note the two or three numbers you want from the Strava ride.
- In Canva, start a 1080 x 1920 design for a Story or 1080 x 1350 for a post.
- Set your ride photo as the background, add a text box per number, big number and small label.
- For the route, crop it from the Strava map and place it where the sky or the road is empty.
Instagram's own Story editor does a quicker version: pick the photo, tap the text tool, type the distance and the elevation.
Good: any layout, any number, including power.
Limits: 10 to 20 minutes per ride, every number typed by hand, and a route cropped from a map keeps its street labels.
Method 4: An app that reads the ride from Strava
An overlay app connects to Strava once and then draws the ride from the activity data itself, so the numbers are exact and the route is a clean line, not a cropped map.
SHUTT is the one I make, on iPhone. It is independent and works with Strava; it is not made by Strava. On accounts created since late October 2026, rides are imported on their own. On an older account, open Settings and turn on Cycling, which also pulls in your recent rides.
- Open a ride and pick a photo from your camera roll.
- Pick a look. Rides get five looks of their own that only show up for rides.
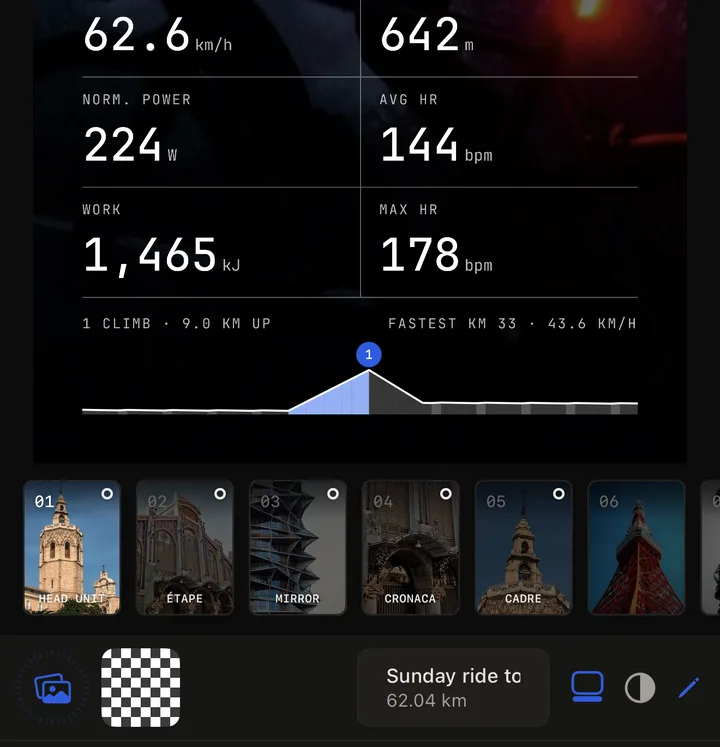
- Change what you want, or leave it. The pencil on a ride look switches its style and changes the typefaces, the type size, the spacing, the margin and how dark the shade behind the type is.
- Pick Story (9:16), Post (4:5) or Square (1:1), then save it or send it straight to an Instagram Story.
The five ride looks:
- Head Unit reads like a bike computer: distance large, then up to eight fields such as moving time, average and max speed, ascent, normalised power and heart rate. Its second style, Laps, puts normalised power (or average speed) large and splits the ride into one lap per climb (or into thirds on a day with fewer than two climbs).
- Mirror draws power above the line and heart rate below it, so you see the effort and the cost on one chart. Power comes from the full ride data SHUTT keeps for Pro rides with a power meter; otherwise it draws speed per kilometre.
- Étape is a roadbook: the title, the distance, then the profile shaded by gradient with the climbs flagged on it. On a flat or indoor ride it draws bars of speed or power instead.
- Cronaca sets the distance huge in a serif, like the front page of a sports paper, with moving time, elevation and speed underneath.
- Cadre frames four numbers around a small route mark with crop marks at the corners.
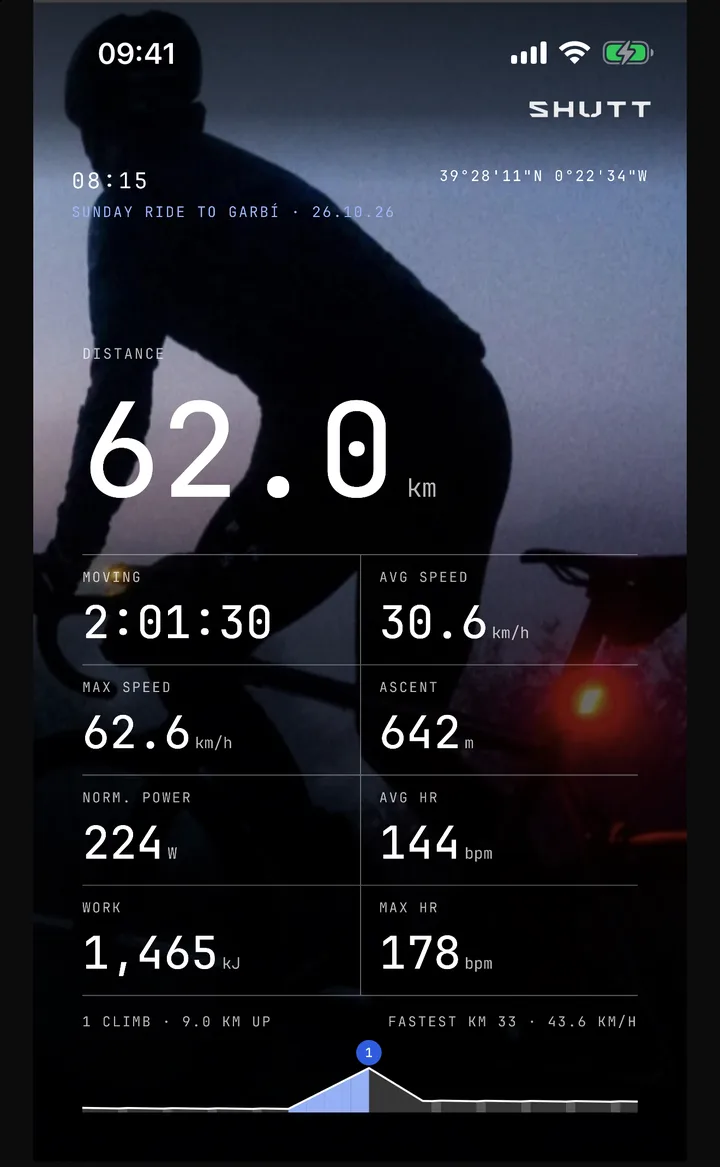
Power only appears when Strava says it was measured by a power meter or smart trainer. Without one, Strava estimates watts from speed and gradient, and SHUTT leaves those out, because a cyclist spots estimated power at once. The full list of numbers is in every stat SHUTT can show, and the route can be drawn in any of the route styles.
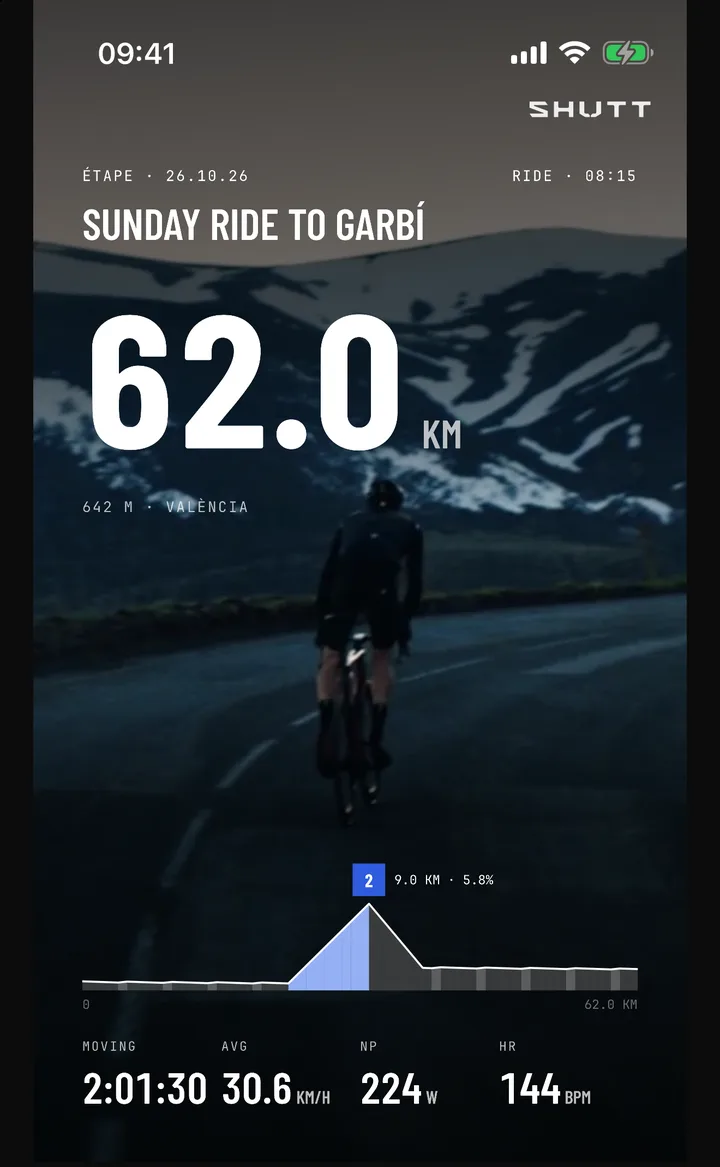
SHUTT only reads your Strava activities; it never changes anything in your Strava account. It is free to use, with a small SHUTT mark on free exports.
Which numbers should a ride post show?
Three or four at most; a Story is looked at for two seconds.
| Ride | Show | Leave off |
|---|---|---|
| Climbing day | Elevation gain, the profile, distance | Average speed (it looks slow out of context) |
| Fast flat ride | Average speed, distance, moving time | The profile (a flat line) |
| Long ride or sportive | Distance, moving time, elevation gain | Max speed |
| Indoor session | Normalised or average power, time | The map (it is a virtual world) |
| Commute | Distance, the route | Speed |
The reasoning behind each line is in how to put speed, elevation and the route on a cycling photo.
A few habits that make ride posts better
- Photograph the ride, not the bike in the hallway. The cafe table, the summit sign, the group in the rain. The numbers are the caption; the photo is the story.
- Use moving time and moving speed. Head units auto-pause, so that is what riders think in. Elapsed time with a coffee stop makes a good ride look slow.
- Keep the route off the rider. Put it where the sky or the tarmac is empty.
- Post the same day. A ride from last weekend reads as old news in a Story.
If you also run, the same ideas for runs are in how to share your Strava runs on Instagram.