SHUTT can put more than 30 stats on a running photo, all read from your Strava activity: the basics like distance, pace and moving time, plus splits, elevation and pace profiles, heart rate and zones, cadence, calories, weather, location, the shoes you wore and more. You choose them in the stats panel by ticking rows and dragging them into order. Heart-rate stats are free to preview and need Pro to save; everything else on this list is free.
This post lists every stat, explains the stats panel, and goes into heart-rate zones, which are the stat people ask about most.
What does Strava's own share show?
At the time of writing (October 2026), Strava's sharing help page says a shared run shows three stats: moving time, distance and pace. Rides show moving time, distance and elevation. Strava says you cannot currently customise these stats, and it uses the units set in your Strava account.
Three numbers is a sensible default; it is what most people want to know. It falls short when the run's story is something else: the elevation of a hill run, the zones of an easy day, the splits of a workout. That is the gap SHUTT fills. The guide to splits, heart rate and elevation goes into which stat suits which kind of run.
The full list
Every row below is a stat in SHUTT's stats panel for a run. Rows the run has no data for stay in the list, marked NO DATA.
| Group | Stats |
|---|---|
| The basics | Distance, Pace, Moving time, Elevation gain, Max elevation, Calories, Cadence |
| When and where | Date & time, Location (city, coordinates or both), Weather, Wind, Humidity |
| The run's story | Activity title, Description, Sport type, Race, Club |
| Kit | Equipment (the shoes you logged in Strava), Device |
| Splits and charts | Splits, Splits table, Elevation profile, Pace profile, Pace sparkline |
| Heart rate (Pro) | Heart rate, Heart rate profile, HR sparkline, HR zones, HR splits, Z2 share, Aerobic decoupling, HR drift |
| Music (Pro) | Song, from a connected music account |
A few notes on the less obvious ones:
- Weather, Wind and Humidity are looked up for the place and hour the run started, from a historical weather service, so they work even if your watch never recorded them. Temperature can show in °C or °F.
- Equipment is the shoe you logged on the activity in Strava, with an option to show the brand's logo.
- Race appears when SHUTT matches the run to a race, and leads the list when it does.
- Z2 share is the share of the run spent in zone 2, the number that proves an easy run was easy.
- Aerobic decoupling and HR drift show how much your heart rate crept up for the same pace over the run.
- Power and the best-power rows are there for runners with a power meter; on most runs they show NO DATA.
How does the stats panel work?
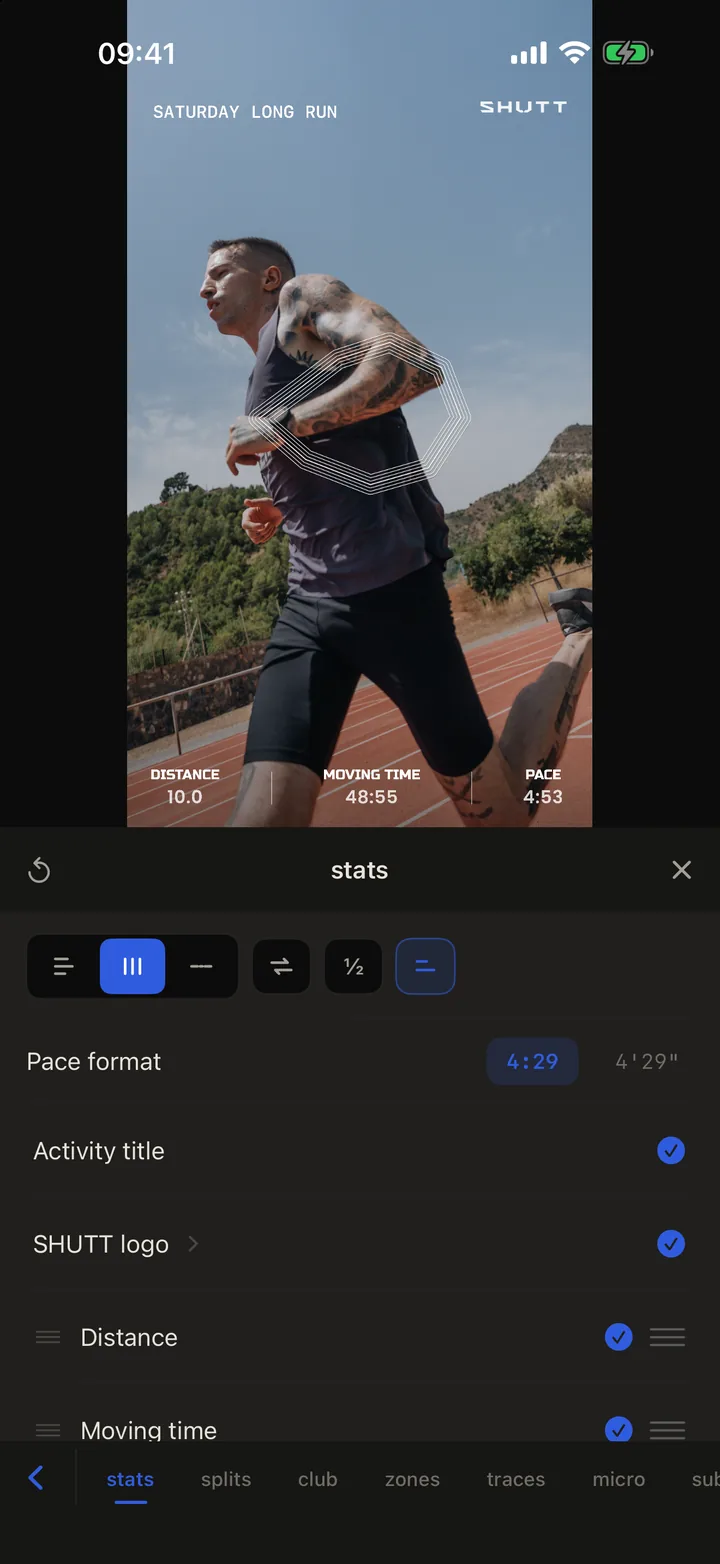
From top to bottom:
- Layout chips. Vertical (stacked rows), Horizontal (side-by-side columns) or Inline (one line). Next to them: a swap chip that turns the block sideways, a ½ chip that shows or hides the units, a chip for the stat labels, and on the vertical layout a left or right alignment chip. Kilometres or miles is set once in Settings.
- Pace format. 4:29 or 4'29". Pick whichever your running friends write.
- Activity title. Your Strava title, on or off.
- SHUTT logo. The small mark on the corner. Free exports keep it; turning it off is part of Pro.
- The stats. Tap the circle on a row to show or hide that stat. Drag the handle to reorder; the order in the list is the order on the photo, and stats you have switched on sit at the top.
- Row settings. Some rows open with a chevron once they are on: Location (city or coordinates), Weather (°C or °F), Equipment (shoe logo), Elevation profile and HR zones (size, alignment, labels).
How do heart-rate zones work?
SHUTT splits heart rate into five zones based on the Max HR you enter in Settings:
| Zone | Share of Max HR |
|---|---|
| Z1 | below 60% |
| Z2 | 60 to 70% |
| Z3 | 70 to 80% |
| Z4 | 80 to 90% |
| Z5 | 90% and above |
Time in each zone comes from the run's heart-rate data. When the full heart-rate stream is not available, SHUTT buckets each kilometre by its average heart rate instead. That is coarser, because a kilometre that crosses a zone boundary lands wholly in one zone, but it means most runs with a heart-rate sensor can show zones at all. If you change your Max HR, the zones follow straight away.
The HR zones stat draws as a bar, with options for width, height, alignment and labels. Z2 share turns the same data into a single percentage.
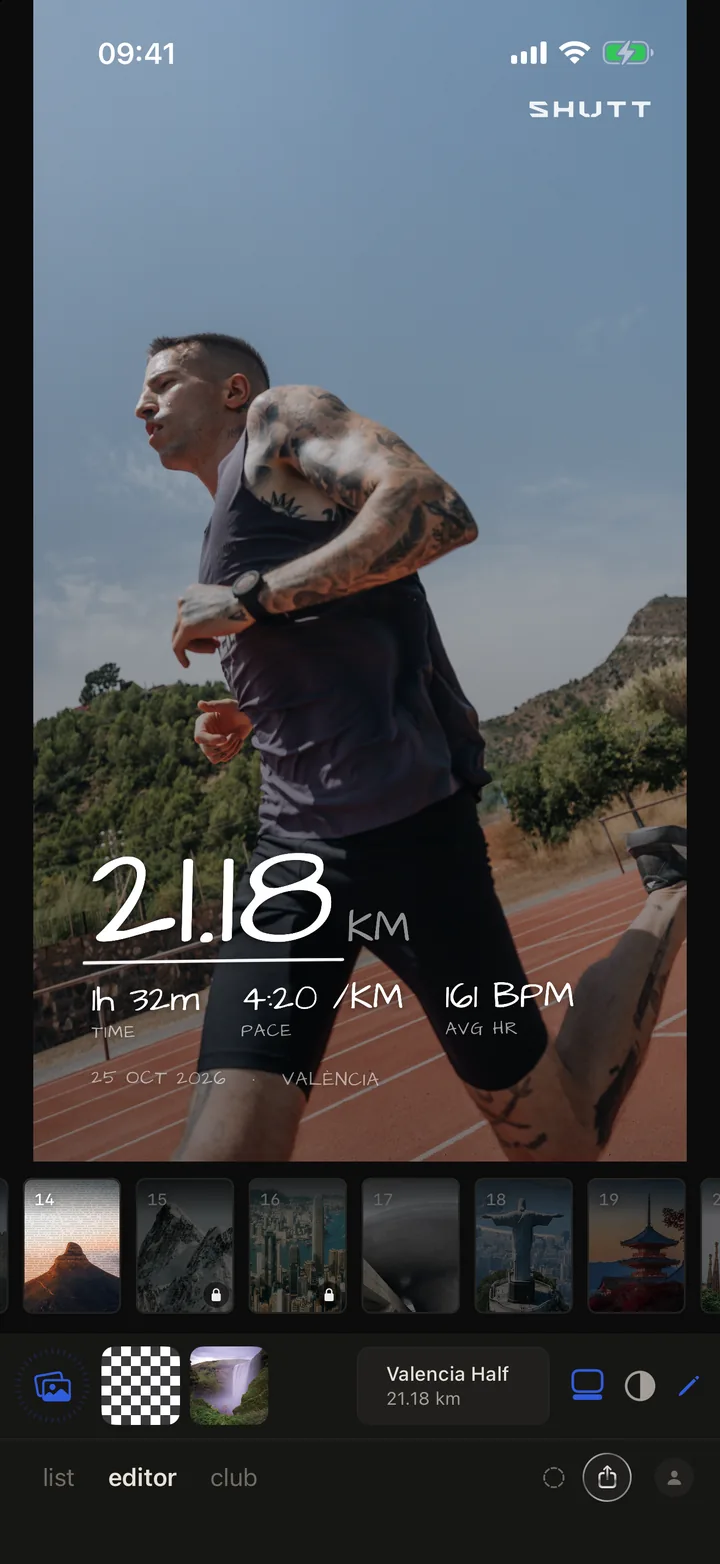
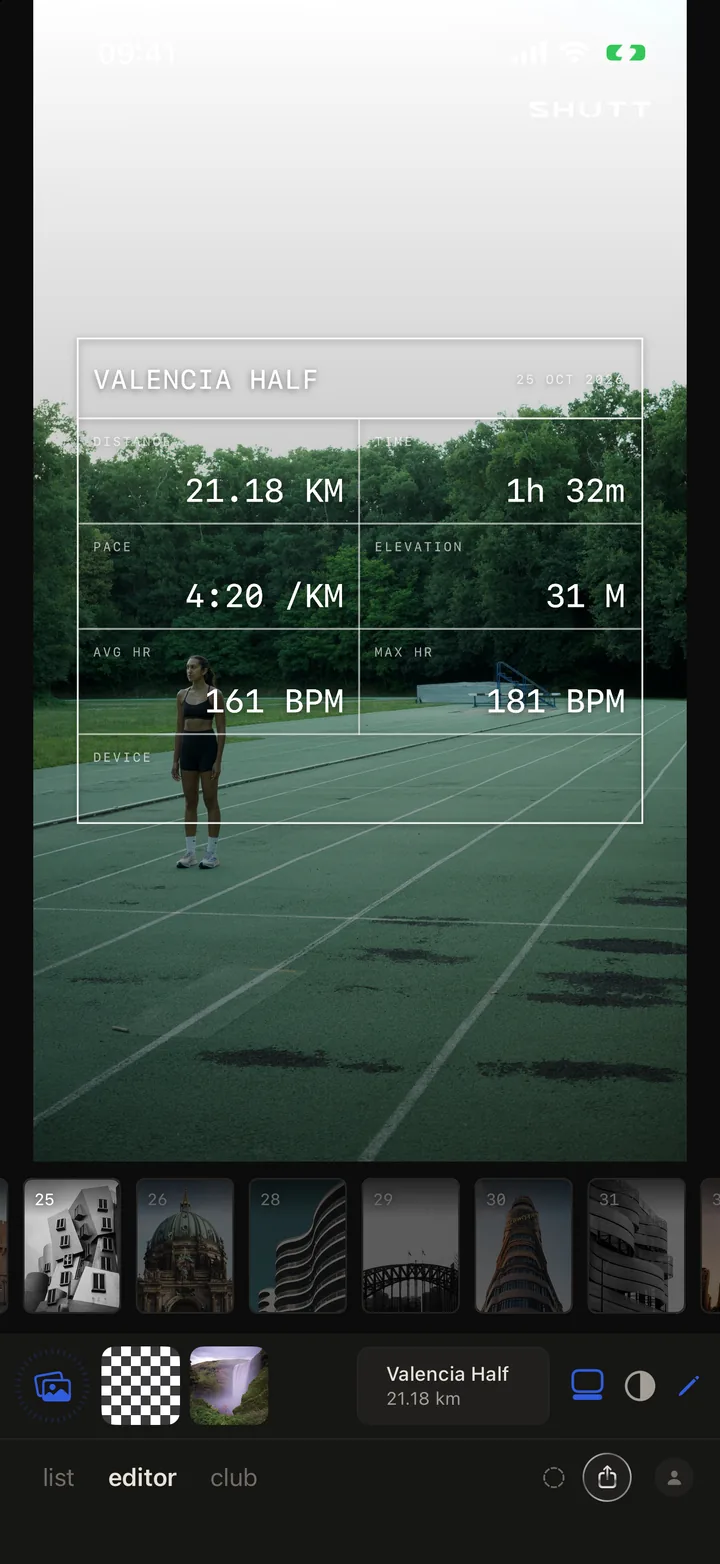
Every heart-rate stat (heart rate, its profile and sparkline, zones, HR splits, Z2 share, decoupling and drift) can be previewed for free. SHUTT asks for Pro when you save a photo with one of them on it.
How to do it in SHUTT
- Connect Strava once, then open a run and a photo in the editor tab.
- Pick a look from the rail. It sets a sensible group of stats to start with.
- Tap the pencil, then the stats tab.
- Choose a layout with the chips at the top: vertical, horizontal or inline.
- Tick the stats you want and untick the rest. Three or four is plenty on a phone screen.
- Drag the handles to put the most important stat first.
- Open a row's chevron for its settings, for example HR zones or Weather.
- Close the panel, check nothing covers a face, and save.
If you want a heart-rate zone stat to mean something, set your Max HR in Settings first.
How many stats should you actually show?
More than 30 to choose from is not an invitation to use them all. On a Story seen for two or three seconds, three or four numbers is the limit before they stop being read. Pick the one that explains the run, then add two or three that support it:
- Easy run: HR zones or Z2 share, distance, pace.
- Long run: distance, elevation gain, moving time.
- Hill run: elevation profile, elevation gain, distance.
- Race: moving time large, pace, date.
- Run in bad weather: weather and wind, distance, pace. Nobody believes the conditions without them.
The guide to running photos with a stats overlay covers the manual ways too, and the guide to SHUTT's looks explains how each look picks its starting stats. The features page has the short version of everything here.