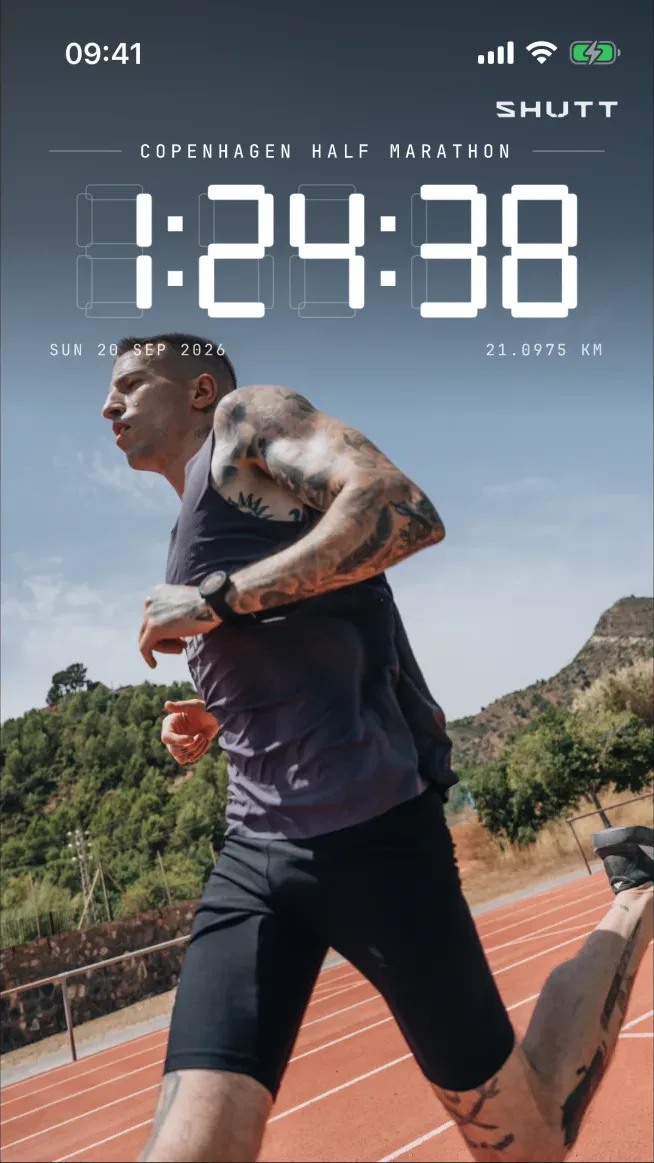
To show race stats on a photo, make your finish time the largest element, print the race name, date and official distance, and add one extra only if it tells the story of that race: splits for a negative split, elevation for a hilly course, the route for a famous one. Use your official or elapsed time, not moving time, and leave your watch's distance off.
Which time is your race time?
| Time | What it measures | Use it? |
|---|---|---|
| Official net (chip) time | Start mat to finish mat | Yes. This is your result. |
| Gun time | Starting gun to finish mat | Only if it is the time your race reports. Usually longer. |
| Strava elapsed time | Pressing start to pressing stop | Yes, if you were quick with the buttons. |
| Strava moving time | Elapsed time minus detected stops | No. It is a training number. |
Strava's own definition treats a race's time as the total from start to finish, including any pauses. If you kept your watch running after the line, crop the end of the activity before you share it. Note that cropping cannot be undone.
Which distance should you print?
The race's. A marathon is 42.195 km or 26.2 miles whatever your watch says. A course is measured along the shortest possible line, while you weave through a crowd, and GPS adds its own error. So a slightly long reading is normal, and it is no reason to post "42.71 km".
Often the word is better than the number. "MARATHON" reads faster than "42.195 KM" and looks less like a spreadsheet.
What should each race distance show?
| Race | Lead with | Worth adding | Usually skip |
|---|---|---|---|
| 5K | Time, pace | A PR note in your own words | Route, elevation |
| 10K | Time, pace | Splits if you ran them evenly | Elevation on a flat course |
| Half marathon | Time | Pace, city and date | Full splits table (21 rows is a lot) |
| Marathon | Time | Route, date, splits by 5 km | Heart rate, calories |
| Trail or ultra | Distance, climbing | Elevation profile, the route | Pace, which means little on a mountain |
When do splits earn their place?
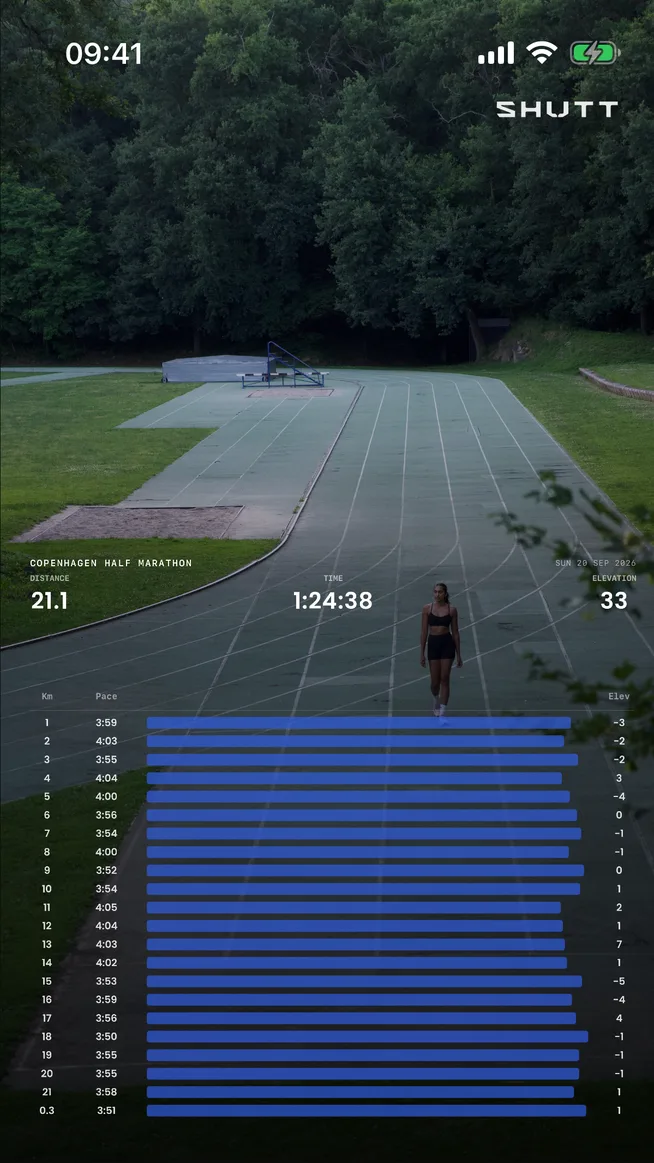
Splits are worth showing when they have a shape.
- Negative split. The second half faster than the first is the proudest thing in a race. Bars show it instantly. You can also just write both halves.
- Even split. Twenty-two nearly identical bars look like discipline, and that is the point.
- A collapse. Runners respect an honest wall at 32 km. Some of the best race posts show it.
- A flat, ordinary race. Skip them. A table of near-identical numbers adds nothing to a photo.
For a marathon, keep it readable by showing splits every 5 km instead of every kilometre, if your tool allows it. The guide to splits, heart rate and elevation has more on reading and placing them.
When do elevation and the route earn their place?
Elevation works when the course has a story. Boston's hills or the bridges of New York look good as a profile. A flat course draws a nearly straight line, so leave it out. Across 25,943 runs in our running data, the median run climbed only 26 m, so a real climb stands out.
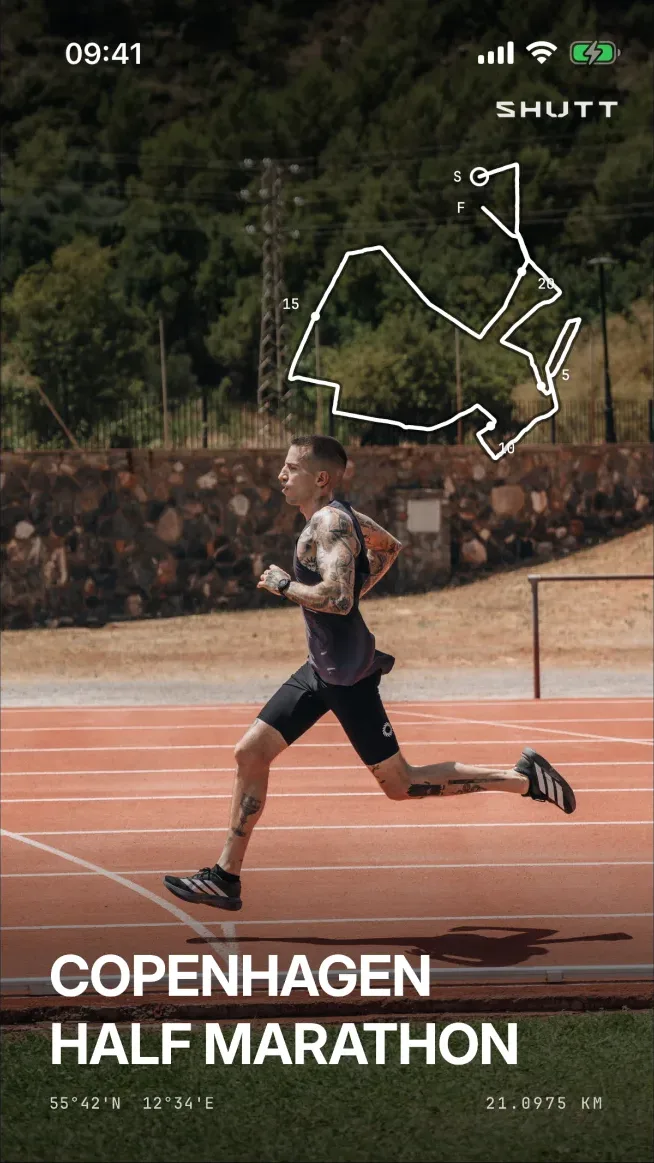
The route works when the shape means something, or when it is the race's signature: a point-to-point like Boston, a tour of a city like New York. A loop around a park usually does not need it. Draw it as a single clean line, not a street map, and put it where the sky or the road is empty.
How do you keep it readable?
- Three or four numbers at most. In our data on run photos, 85% of exports had zero or one extra element beyond the basic stats.
- Units on everything except the time. "3:28:41" needs no label, but "4:56" does: "/km".
- Design for 9:16 first. 99.7% of the run images in that same data were Stories.
- Use a dark band on a bright photo. Race photos are often all sky and pale road, and white text disappears. A soft dark band behind the numbers fixes it.
- Mind your bib. Your number can be looked up in the race results, so crop or cover it if that bothers you.
How do you add them?
By hand, free: in Instagram Stories, place Strava's share sticker over your photo and type your official time large above it. Crop splits or the elevation chart from a Strava screenshot if you want them. It takes ten minutes or so and carries Strava's own design.
From your Strava activity: an overlay app reads the race and lays it out. In SHUTT, which I make (iPhone only), a run that matches a race in its calendar is recognised automatically. It then gets the official distance and your elapsed time, plus two race-day looks at the start of the list: Finish and Course, both free. The Race row in the stats tab lets you edit the race name; open it from the pencil on a stats look such as Press. Splits, elevation and the route are free too; heart-rate stats need Pro to save, and free exports carry a small SHUTT mark.
Racing the New York City Marathon? The NYC Marathon guide covers that course. For a keepsake to frame, see race posters from Strava.