The typical run logged on Strava in 2026 was 7.6 km, took about 45 minutes and was run at 5:44 per km, based on 25,943 runs by 462 runners between 1 January and 17 October 2026. 37% of those runs stopped within 100 m after a whole kilometre, 62% of runs of 15 km or more happened on a Saturday or Sunday, and 84% recorded heart rate.
These are runs synced by people who use SHUTT, an iPhone app that puts Strava stats on photos, so they come from runners who share their runs. The numbers describe the runs themselves, not what people later put on their photos. The methodology section has the full details and limits.
How far does the typical runner go?
The median run was 7.6 km. The mean was higher, 9.0 km, because a small number of long runs pull the average up. Half of all runs were between 5.0 and 11.0 km.
| Distance | Share of runs |
|---|---|
| Under 5 km | 22% |
| 5 to 10 km | 42% |
| 10 to 15 km | 22% |
| 15 to 21 km | 7% |
| 21 to 30 km | 4% |
| 30 to 42 km | 0.8% |
| 42 km or more | 0.5% |
Some runners log far more runs than others (the median runner logged 42 in the period). Taking each runner's own median distance first, so that every runner counts once, the typical runner's usual run was 6.9 km.
What pace do most people run at?
Across the 22,852 runs of 3 km or more, the median pace was 5:44 per km. Weighted by runner instead of by run, the typical pace was 5:57 per km.
| Pace per km | Share of runs |
|---|---|
| Faster than 4:00 | 1% |
| 4:00 to 4:30 | 4% |
| 4:30 to 5:00 | 12% |
| 5:00 to 5:30 | 22% |
| 5:30 to 6:00 | 21% |
| 6:00 to 7:00 | 23% |
| 7:00 to 8:00 | 9% |
| Slower than 8:00 | 7% |
Longer runs were faster, not slower. The median pace was 6:11 per km for runs of 3 to 5 km, 5:51 for 5 to 10 km, and 5:29 for 10 to 21 km. That is a selection effect rather than a contradiction: faster, more trained runners are the ones doing most of the long runs, while short runs include warm-ups, recovery jogs and beginners.
Do runners really stop at round numbers?
They do, and by a wide margin. If runs ended at random, about 10% would finish in the 100 m just after a whole kilometre and 10% in the 100 m just before one. In this data:
- 37% of runs over 2 km ended in the first 100 m after a whole kilometre.
- 5% ended in the last 100 m before one.
- Runs of 5.00 to 5.09 km were 9 times as common as runs of 4.90 to 4.99 km (1,707 against 181).
- Runs of 10.00 to 10.09 km were 11 times as common as runs of 9.90 to 9.99 km (1,170 against 105).
The likely reason is the number on the screen. A run that shows "5.0 km" on the watch, on Strava and on a shared photo reads as finished; "4.94 km" reads as almost. At the half marathon it shows up one step later: runs of 21.1 to 21.5 km (318) far outnumber runs of 21.0 to 21.1 km (72), because 21.1 km, not 21, is the number that counts.
Which day is long run day?
Sunday. Of the 3,118 runs of 15 km or more, 36% were on a Sunday and 26% on a Saturday, so 62% of long runs happened at the weekend.
| Day | Share of all runs | Average distance |
|---|---|---|
| Monday | 11% | 8.6 km |
| Tuesday | 15% | 8.5 km |
| Wednesday | 15% | 8.0 km |
| Thursday | 15% | 8.3 km |
| Friday | 12% | 8.8 km |
| Saturday | 17% | 10.9 km |
| Sunday | 16% | 12.3 km |
Saturday was the busiest day for running and Monday the quietest. The day is the runner's local day, worked out from where each run started.
What time of day do people run?
Mornings, by a clear margin. Strava names an activity after the time of day it started ("Morning Run", "Evening Run") unless the runner renames it. At least 54% of runs kept that default name, and among them:
| Strava's label | Share |
|---|---|
| Morning | 45% |
| Afternoon | 21% |
| Evening | 20% |
| Lunch | 7% |
| Night | 7% |
So nearly half of the runs that kept Strava's name were morning runs. The rest were renamed, often with a session type ("Tempo", "Easy run", "Warm up"), or use a language not counted here.
Which watch do runners record with?
Counting each runner once, by the device that recorded most of their runs, out of the 455 runners whose device was known:
| Main device | Share of runners |
|---|---|
| Garmin | 53% |
| Apple Watch | 15% |
| Strava app on a phone | 15% |
| COROS | 9% |
| Other apps and services (Runna, Nike Run Club and others) | 3% |
| Amazfit | 2% |
| Suunto | 2% |
| Others | 2% |
COROS punches above its share of runners in volume: its users logged 13% of all runs with a known device, against 9% of runners, so they tended to run more often.
Among the 251 runners who log shoes on Strava, the brand of the shoe they ran in most was close to a three-way tie: ASICS (20%), Nike (20%) and adidas (18%), then HOKA and New Balance (6% each). Brands were matched from the shoe name the runner typed, so treat these as approximate.
How many runs have heart rate, a route and hills?
- 84% of runs recorded heart rate. The median average heart rate was 149 bpm.
- 90% had a GPS route. The other 10% were mostly treadmill and indoor runs.
- 15% climbed 100 m or more. The median run climbed only 26 m.
- 2% were tagged as trail runs.
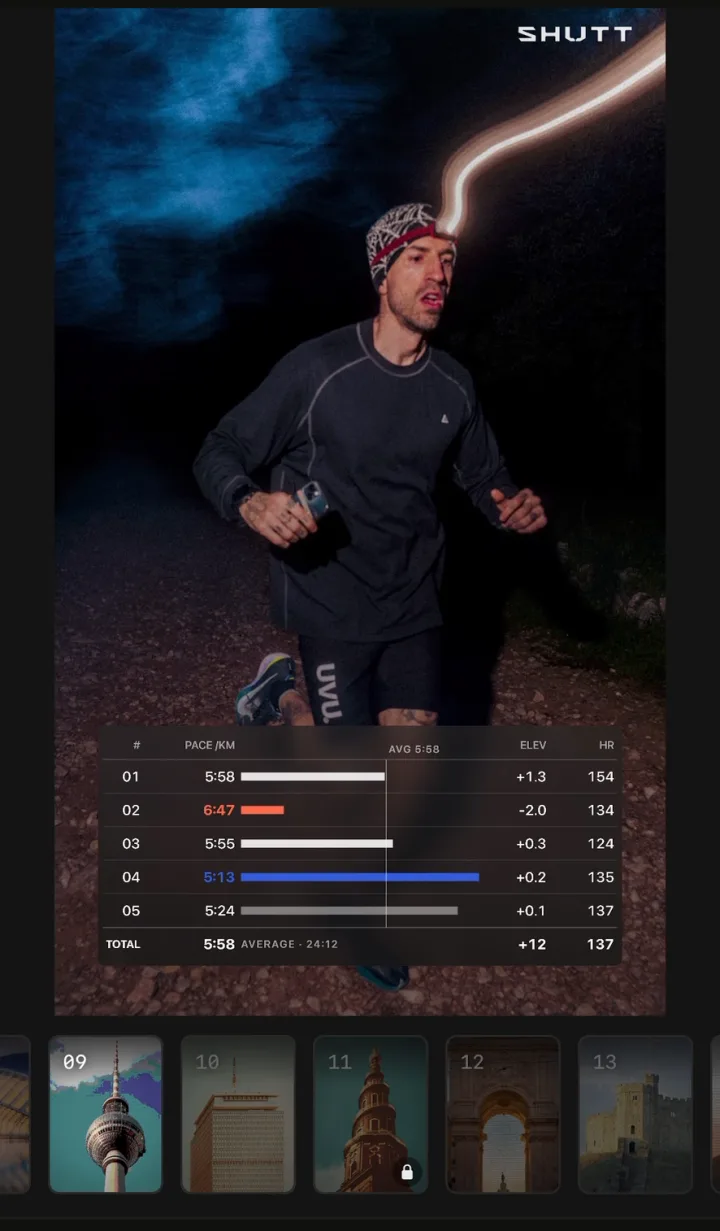
For anyone putting a run on a photo, this is the practical point: almost every run has a route and heart rate to show, but only one in seven has enough climbing for an elevation profile to say much. The guide to showing splits, heart rate and elevation on a running photo covers which stat suits which run.
Runs or rides?
Among the 64 people who switched cycling on, rides made up 47% of their activities. The median outdoor ride was 19.5 km and the median indoor ride 32.2 km, against 5.8 km for their runs.
Across the whole sample, 93% of activities were runs, but that mostly reflects the app: SHUTT imports rides only for people who switch cycling on, so it is not a measure of how many people run versus ride.
Methodology
- Source: Strava activities synced by people who use SHUTT, read from its database on 18 October 2026 with read-only queries that return totals only.
- Period: runs that started between 1 January and 17 October 2026.
- Sample: 25,943 runs (including trail runs) by 462 runners, with a positive distance and moving time. The developer's own account is excluded.
- Pace: moving time divided by distance, for the 22,852 runs of 3 km or more.
- Day of week: local day, estimated from the longitude of each run's start point, for the 22,346 runs with GPS.
- Time of day: taken from Strava's default activity names in English, Spanish, Portuguese, Italian, French, German, Norwegian and Russian. Runs in other languages and renamed runs are left out of that table.
- Devices: the device that recorded most of each runner's runs. Groups with fewer than 5 runners are folded into "Others".
- Who this covers: runners who share their runs on social media, from at least 35 countries, with the most runs from the United States, Spain, the United Kingdom, Brazil and Australia. They are not a random sample of all Strava users.
- Privacy: only totals and shares are reported. No runner, activity, route or location can be identified.
- Percentages are rounded, so some tables do not add up to exactly 100.