Runners make Stories from photos, and they keep them simple. Of 380 run images exported by 71 runners between 12 August and 17 October 2026, 83% were photos rather than videos, 99.7% were in the 9:16 Story format, 43% carried nothing beyond the numbers, and the route was the extra most often added, on 34% of them.
The data comes from SHUTT, the iPhone app I make that puts Strava stats on run photos and videos. It records what was on each image at the moment it was saved, without the image itself. It is a small sample from a young app, so read the percentages as a snapshot, not a census. The methodology section has every base and limit.
Do runners share photos or videos?
Photos, by a wide margin.
| Saved as | Exports | Share |
|---|---|---|
| Photo | 317 | 83% |
| Video | 63 | 17% |
Video is a minority habit rather than a rare one: 15 of the 71 runners (21%) exported at least one video. Looking at what the stats were placed on:
- Photo: 71% of exports
- Video: 17%
- Transparent background: 12%. That is a sticker of stats and route with no picture behind it, meant to be laid over a photo inside Instagram.
Story, feed post or square?
Story, almost without exception. Of the 361 exports whose format was recorded, 360 were 9:16 Stories (1080 x 1920). One was a 4:5 feed post and none were square.
Story is the size SHUTT opens on, and the post and square sizes are one tap away, so this mostly shows that runners do not change the default. It also matches where run photos go: a Story disappears after a day, which suits a training log better than a permanent grid post. The guide to sharing Strava runs on Instagram covers the sizes for each.
How the image left the app:
- Saved to the camera roll first: 83% of exports.
- Sent straight to Instagram Stories: 17%. 19 of the 71 runners (27%) used this route at least once.
What do runners put on the photo besides the numbers?
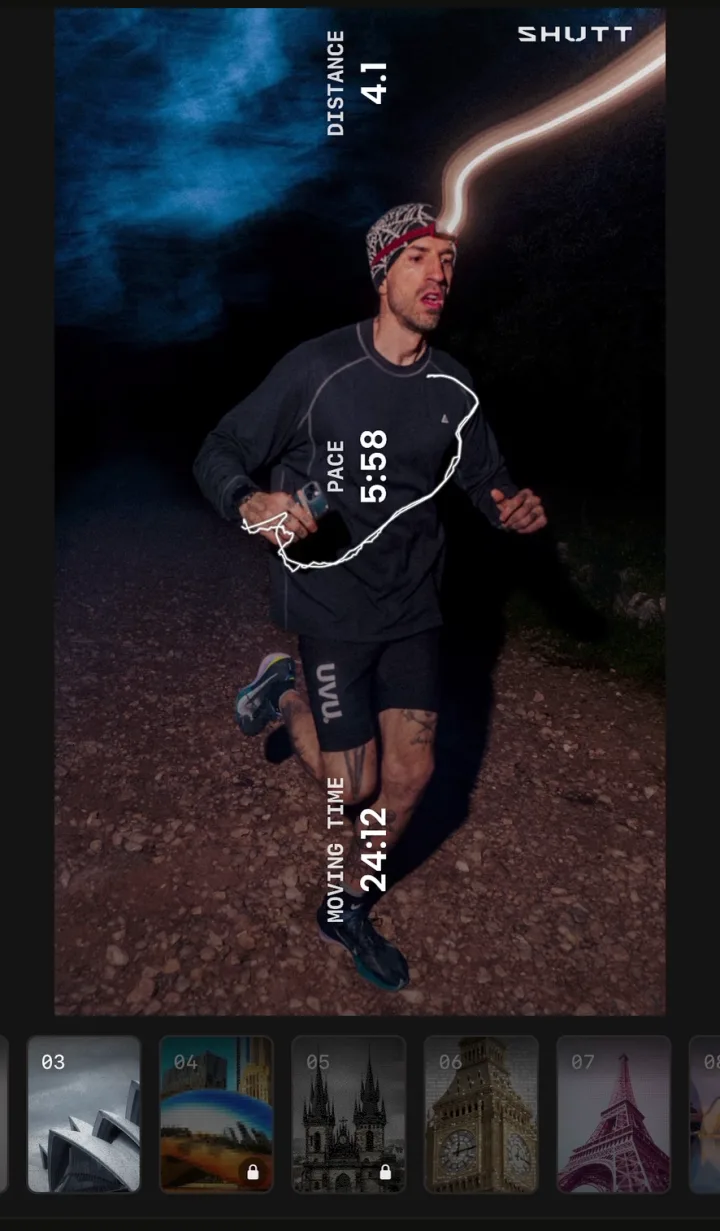
The basic stats (distance, pace, time) are on nearly every image, so the useful question is what people added on top. Across the 361 exports where this was recorded:
| Added to the image | Share of exports |
|---|---|
| The route | 34% |
| A chart of elevation, pace or heart rate | 13% |
| Small technical graphics (coordinates, tick scales, barcodes and similar) | 11% |
| Splits | 8% |
| A photo cut-out, with the runner in front of the stats | 4% |
| The song that was playing | 2% |
Some notes on the table:
- The route is the one extra a large share of runners reach for: at least 28 of the 71 runners saved an image with it. Only 5% of exports drew the route in a styled form (neon, contour, echo and others); the rest used a plain line.
- Heart rate appeared on under 3% of exports, even though the running data post found that 84% of runs record it. People record heart rate for themselves, not for the photo.
- Elevation was charted on 7% of exports, about half the share of runs (15%) that climb 100 m or more, where a profile has something to show.
How many extras does a typical run photo carry?
One at most.
| Extra elements | Share of exports |
|---|---|
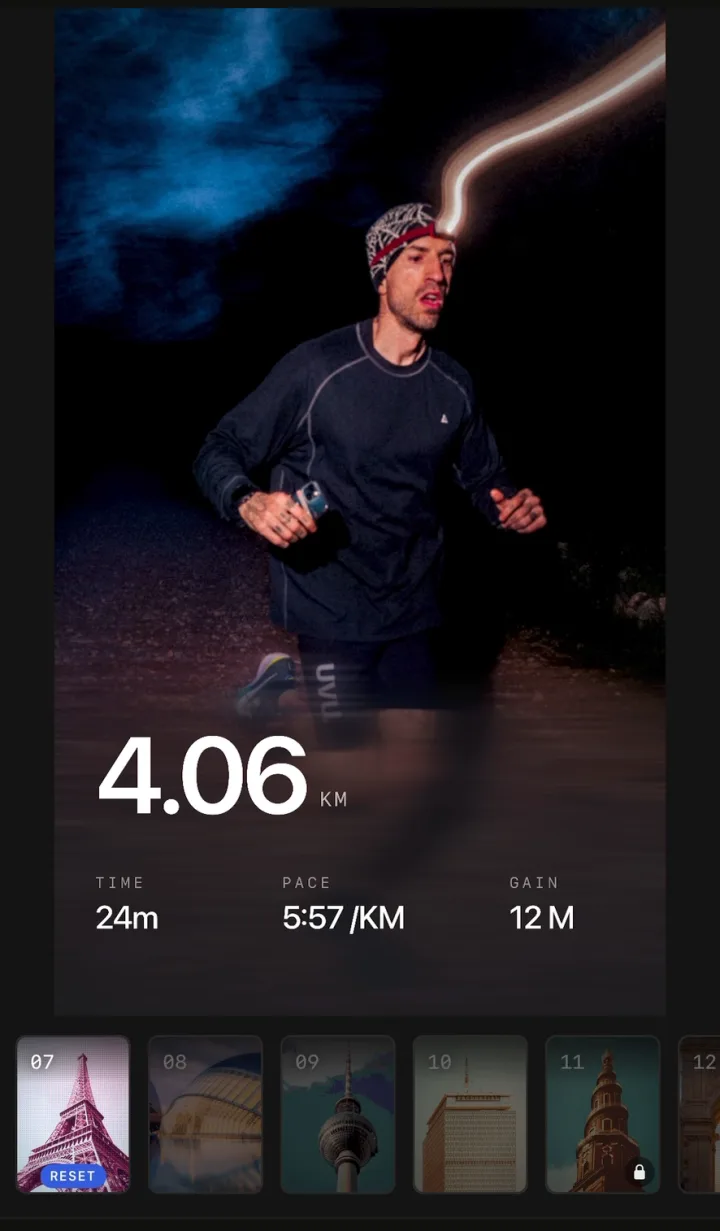
| None, just the numbers | 43% |
| One | 42% |
| Two | 12% |
| Three or more | 2% |
So 85% of exports had zero or one extra element. That lines up with the usual advice for legibility on a phone screen: three or four numbers and one picture element is about what fits in the two or three seconds a Story is looked at. The guide to splits, heart rate and elevation on a running photo goes through which extra suits which kind of run.
Which looks do runners pick?
A look is a finished design (typeface, layout and stats) applied in one tap. From 29 August, when looks started being recorded, there were 315 exports by 62 runners. 94 of those came from older app versions that do not record the look, which leaves 221.
- 218 of the 221 (99%) used a look rather than a blank layout.
- 24 different looks were used at least once.
- Press was the most used by far: 72 exports, by 26 of the 62 runners (42%). It is a horizontal row of distance, time and pace with the route, and it is also the first look on the list and the one the first-run tour opens, so some of its lead is position.
- The next most used, each by at least 5 runners: Route interior (15 exports), Dusk (12) and Plate (8).
What this means if you are designing your own run photo
Whatever tool you use, Canva, Strava's own share card or an overlay app, these numbers point the same way:
- Design for 9:16 first. Nearly every run image here was a Story. A 4:5 or square version is the exception, not the starting point.
- Keep the numbers, add one thing. Most exports had the basic stats plus at most one extra. Pick the one that explains the run.
- Make that extra the route unless the run was about something else. It is what runners choose most, and it is the element that says where you were.
- Leave heart rate for training logs. It is on most runs and almost no photos.
Methodology
- Source: an anonymous event the SHUTT iPhone app sends each time an image or video is saved or sent to Instagram. It lists the format, what the stats were placed on, the look, and which extra elements actually drew. It contains no image, no activity and no location.
- Period: 12 August to 17 October 2026 (Pacific time). Looks: 29 August to 17 October 2026.
- Sample: 380 exports by 71 runners. Format, canvas and extras were recorded on 361 of them; the other 19 came from an older app version.
- Excluded: TestFlight, debug and simulator builds. The developer's own account had no exports in the production data.
- What is not measured: exactly which basic numbers (distance, pace, time, date) were on each image, the distance of the activity, and whether it was a run or a ride. The app does not record those with an export. For distances and paces of the runs themselves, see the running data post.
- Small groups: looks are named only when at least 5 different runners used them. Shares of exports can be driven by a few heavy users, so shares of runners are given where they matter.
- Privacy: only totals are reported. No runner, photo or activity can be identified.
- Percentages are rounded, so some tables do not add up to exactly 100.